Modern technology runs on standards. From 5G cellular networks to Wi-Fi connectivity and Bluetooth pairing, industry standards ensure that devices from different manufacturers can communicate seamlessly. When a patented invention is essential to implementing one of these standards (meaning you cannot comply with the standard without using the patented technology), that patent becomes a Standard Essential Patent (SEP).
SEPs sit at a unique intersection of intellectual property law and industry collaboration. Patent holders who contribute technology to a standard typically commit to licensing their SEPs on Fair, Reasonable, and Non-Discriminatory (FRAND) terms. This ensures that standardized technology remains accessible while inventors are fairly compensated.
But how do you prove that a patent is actually essential to a standard? With a claim chart.
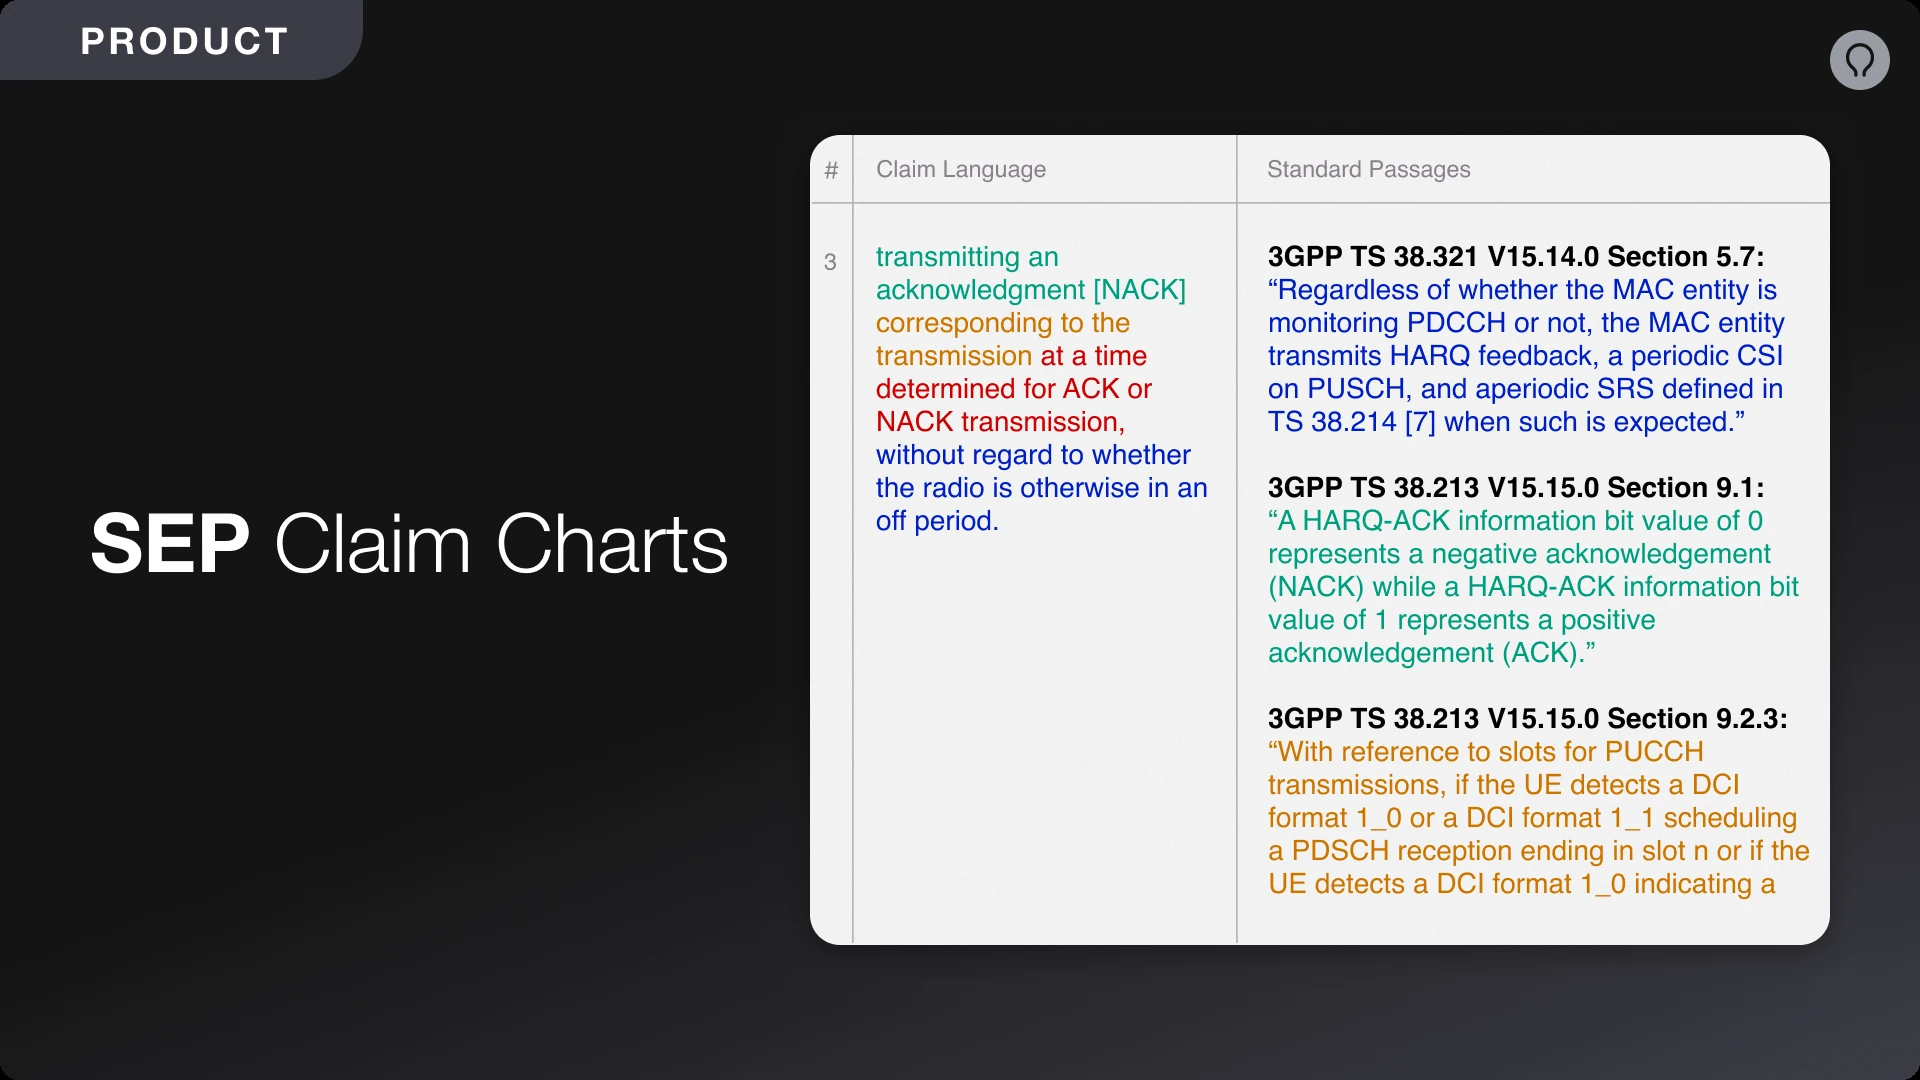
A claim chart is a document that maps each element of a patent claim to corresponding portions of a standard, demonstrating that practicing the standard necessarily infringes the patent. These charts are critical for SEP licensing negotiations, FRAND rate determinations, and patent litigation.
Creating high-quality SEP claim charts is not an easy task. Here's why:
Technical standards documents are enormous. A single 5G specification can span thousands of pages of dense technical language across multiple releases and versions. Determining which parts of a standard are relevant to each claim element without a priori knowledge can be extremely difficult.
Patent claims (and technical standards) often evolve during prosecution. Amendments made to the claims during prosecution can strengthen or weaken the mapping between the standards and the claims. Practitioners must “thread the needle” to obtain claims that read on the standards and distinguish from the prior art (which includes previous releases of the standards).
Standards evolve through lengthy deliberation processes. Proposals from industry representatives are often rejected or modified before they are incorporated into a standard. Companies that file patent applications on their proposals face uncertainty about which aspects will be adopted, and how those aspects will be reflected in the standard. For that reason, it is important to draft claims
According to a 2021 study, only 8% of patent families declared as essential to Fifth Generation (5G) wireless standards are in fact essential to those standards. The vast majority of self-declared SEPs listed in databases such as the European Telecommunications Standards Institute (ETSI) Intellectual Property Rights (IPR) have not been thoroughly charted, and the majority of Standard Development Organizations (SDOs) do not conduct an analysis to verify whether declared patents are essential or not.
Claim charting can be prohibitively expensive. A proper analysis of a single claim requires a skilled practitioner to spend multiple hours (at a minimum) to confirm whether the claim reads on a particular standard. For portfolios with hundreds or thousands of patents, manually charting every patent is economically unfeasible.
We recently launched Charts to address these challenges and accelerate the claim charting process. With Charts, you can analyze patent claims, find relevant standards, and generate accurate claim charts in a fraction of the time. Here’s a walkthrough of how to build a SEP claim chart from start to finish using Charts:
Start by creating a new chart project in Solve. The project will have two inputs:
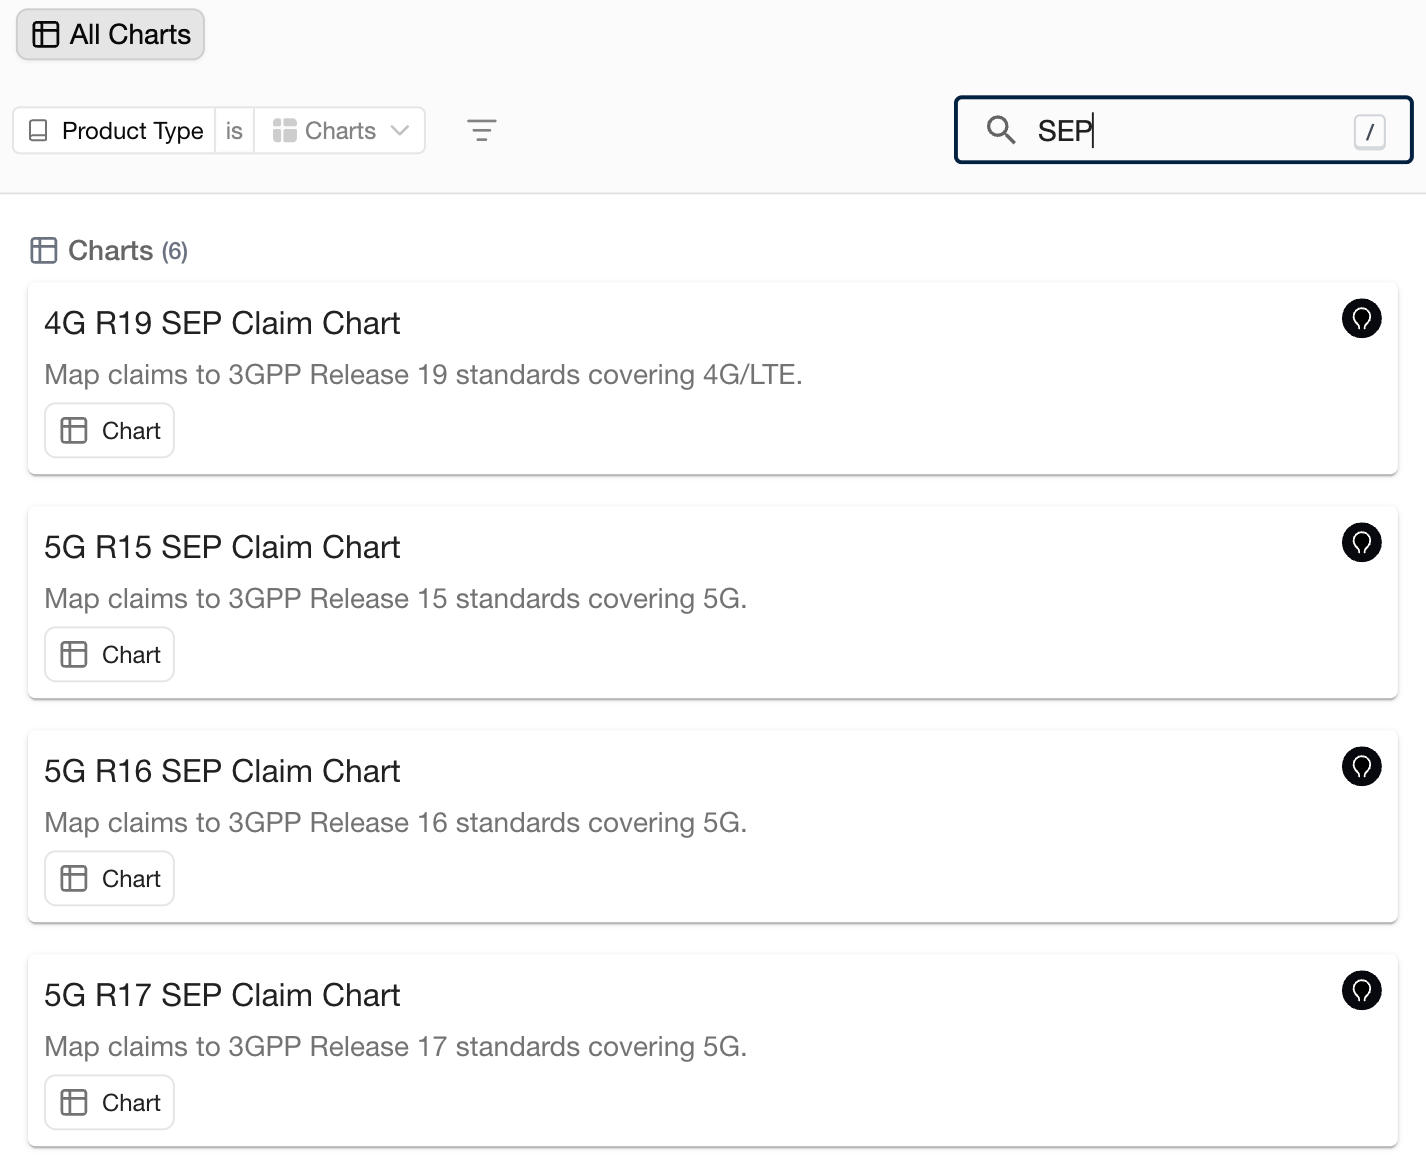
To streamline the project creation process, you can start from one of our default SEP claim chart templates, which include copies of the most popular standards:
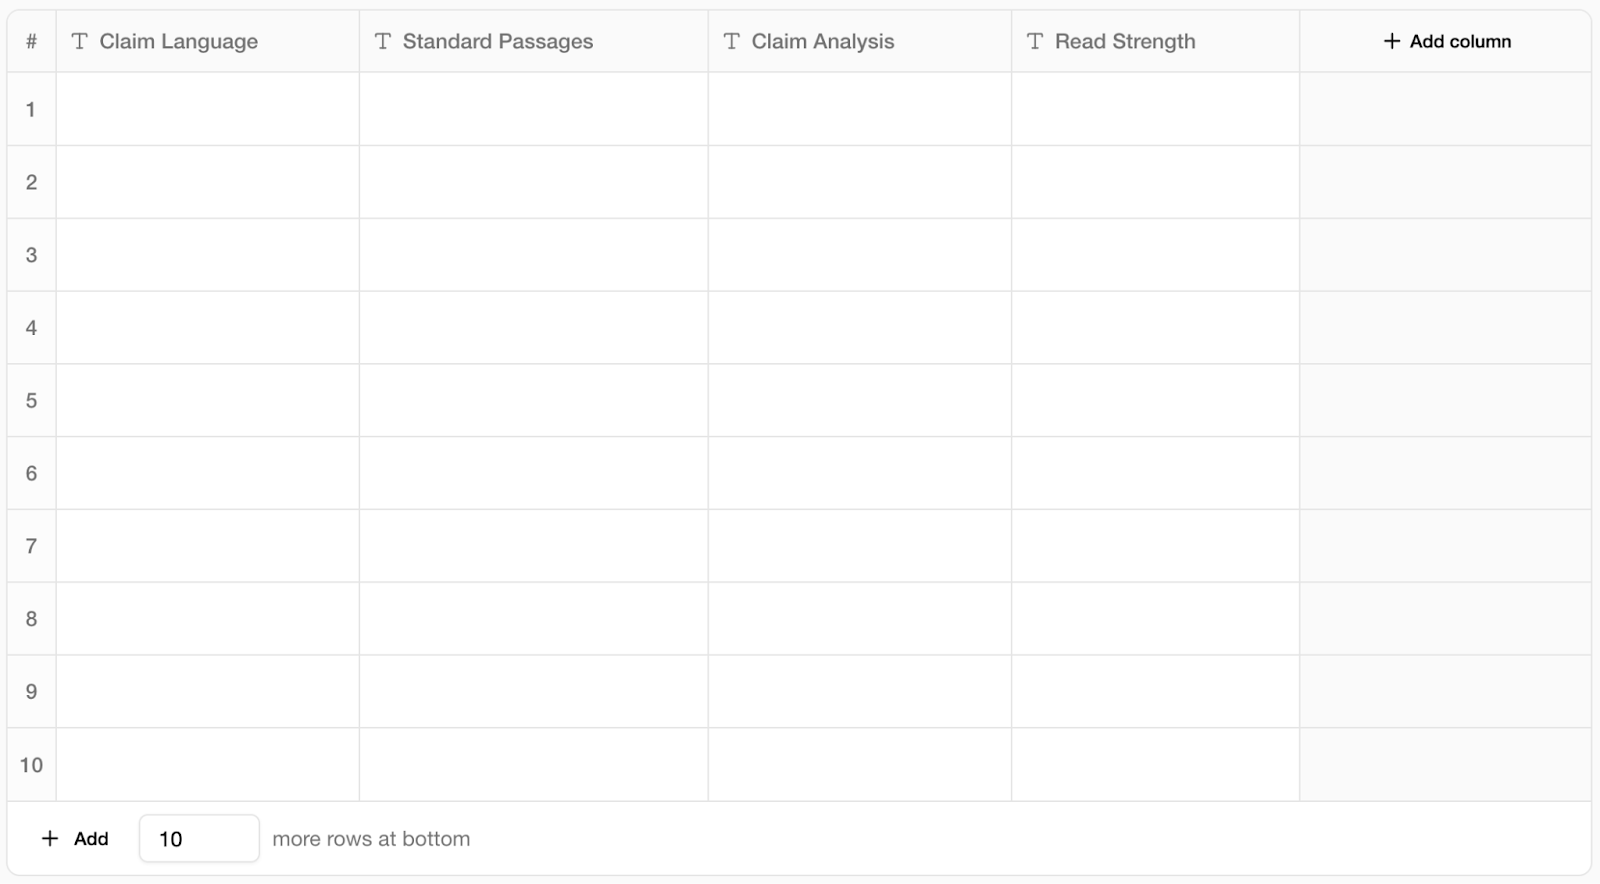
Choose which columns you want to include in the chart. By default, our SEP chart templates include the following columns:
Each column has an associated instruction, which you can view or modify by clicking on the column heading. You can further customize the chart layout by removing, reordering, or adding columns to the chart:
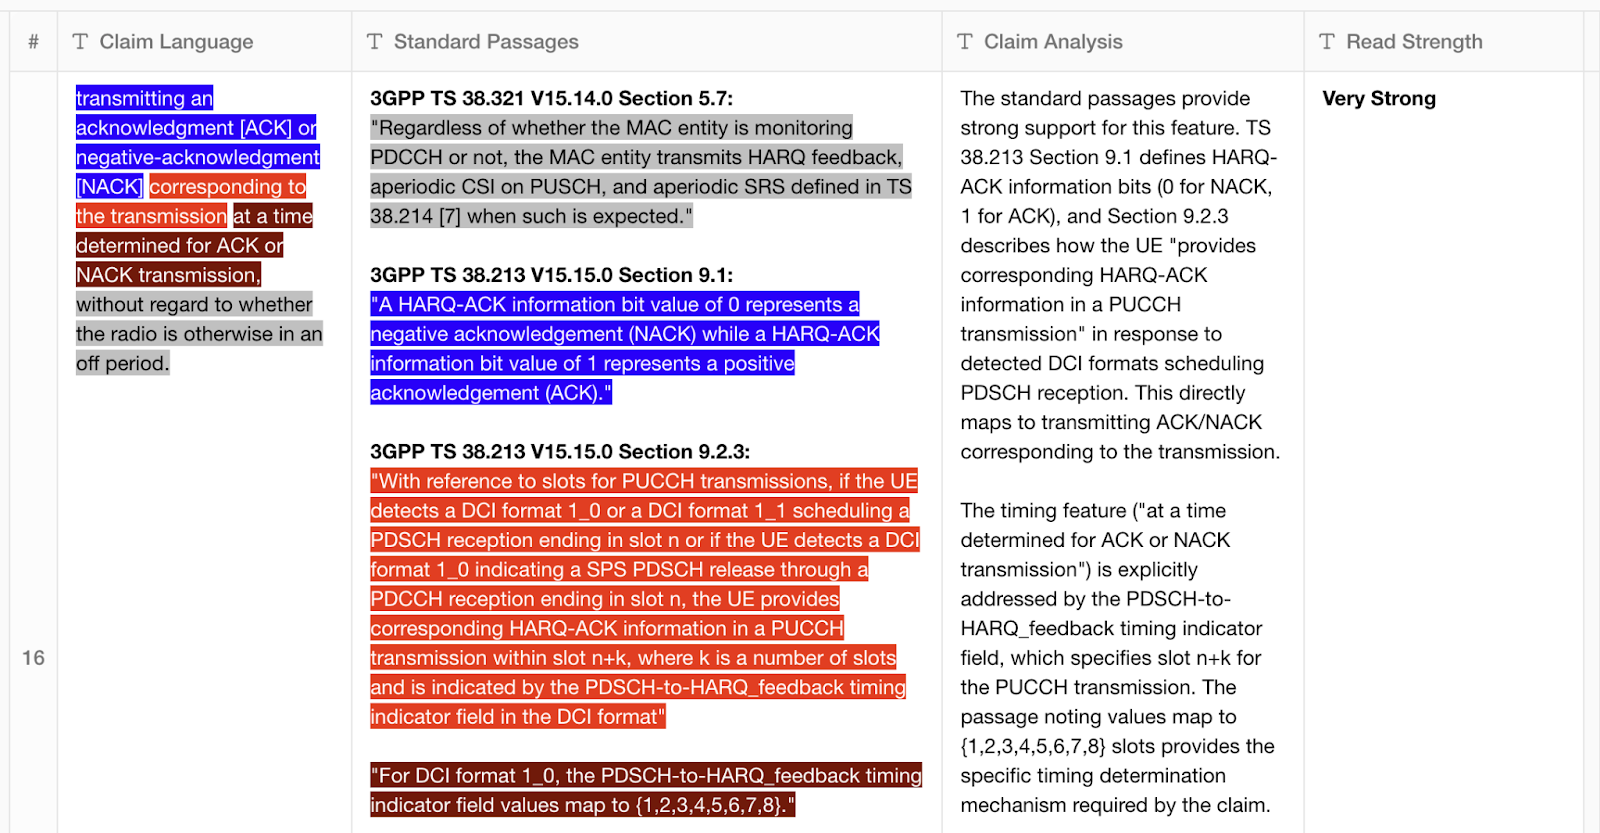
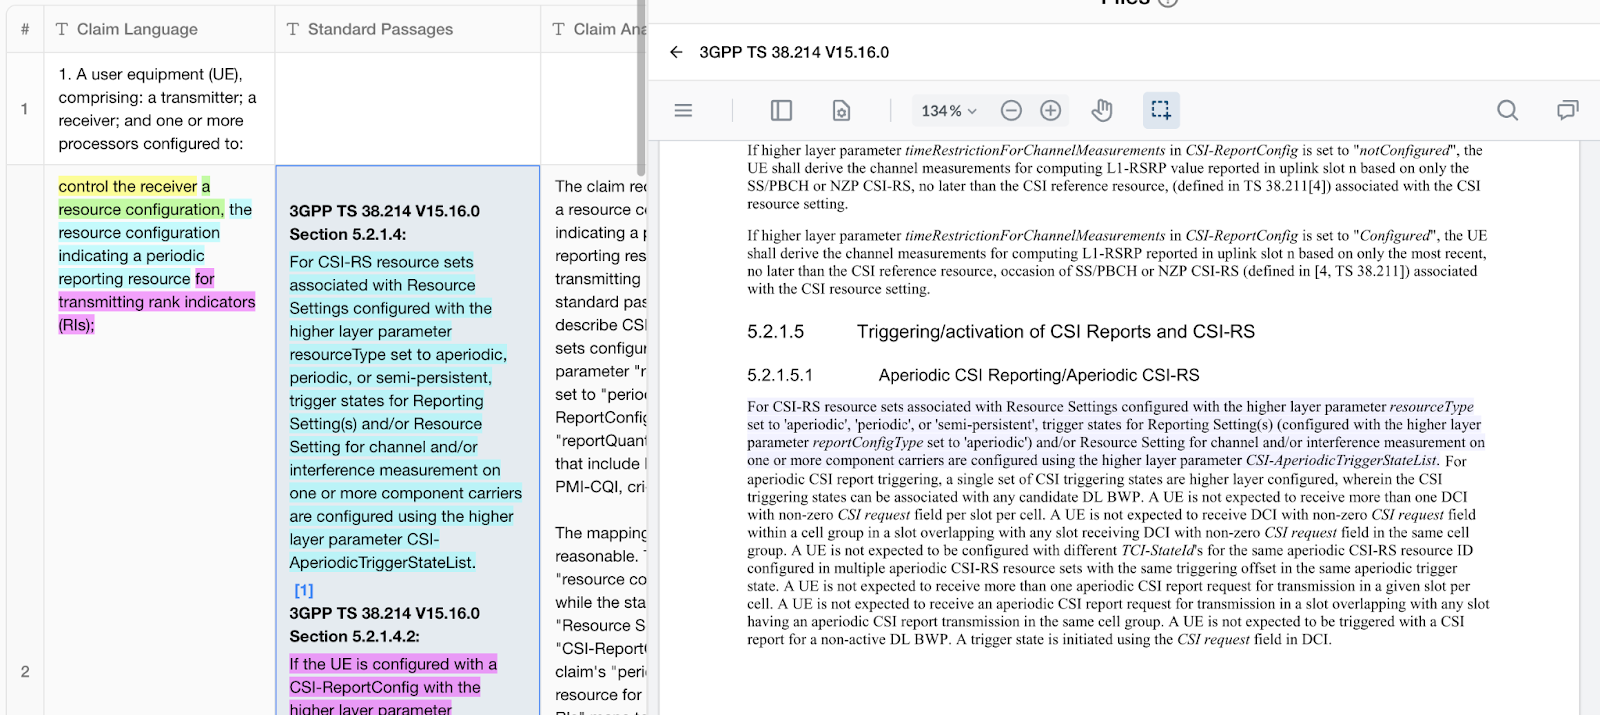
You can either run all columns at once, or iteratively generate and refine one column at a time. For projects with multiple charts, you can run multiple charts in parallel. By default, the AI will extract all independent claims from the target patent or application, split each claim up, and color code each claim feature to show the mapping between the claim language and the standard passages:
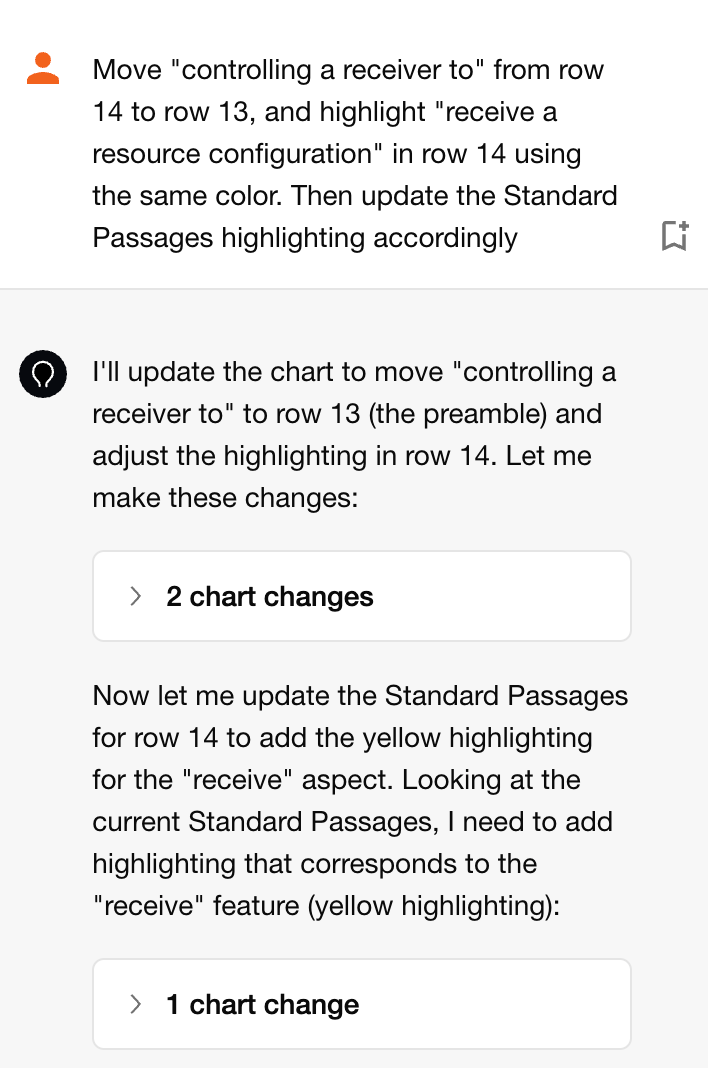
You can make changes to the chart yourself, or use the Chat interface to quickly update the format or content of the chart:
Once finalized, you can export the claim chart in your preferred format.
AI excels at processing massive volumes of text and identifying connections between documents. Technical standards use varied terminology; what a patent refers to as a "downlink resource" might be described as a "CORESET" or "PDCCH" in the standard. With Solve Intelligence, you can use AI to scan through thousands of pages of standards documentation in minutes, surfacing relevant passages that a human reviewer might overlook or never find given time constraints.
Our AI can highlight weak areas in the mapping and suggest alternative language to improve the standards read. This allows practitioners to:
Within each column of the chart, you can enable clickable citations that take you directly to the relevant part of the cited document. This allows you to quickly verify that standard passages and claim limitations have been accurately extracted:
SEP claim charting can be a bottleneck in patent licensing and portfolio management: too time-consuming and expensive to perform rigorously at scale, yet too important to skip. Solve Intelligence is changing this equation, allowing practitioners to generate high-quality claim charts in minutes rather than hours, while surfacing insights that might otherwise be missed.
Whether you're building a SEP portfolio, preparing for licensing negotiations, or assessing essentiality for litigation, AI-powered claim charting provides a force multiplier for patent professionals: deeper insights, faster turnaround, and more comprehensive analysis than manual approaches alone can deliver.

.jpeg)